Custom Analytics & Visualization Services
Unlock deeper insights and optimize your operations with analytics purpose built for real time location data.
WISER Systems helps you turn continuous RTLS signals into clear, actionable decisions. Our Enhanced Analytics & Visualization Services layer on top of the WISER Tracker platform to illuminate flow, dwell, and process behavior so you can improve efficiency, reduce cost, and move faster with confidence.
Capabilities
- Seamless Data Integration – Connect WISER Tracker data directly to your other systems, whether that is an ERP, MES, or data lake, through secure APIs or direct database links. We can also set up scheduled data exports for use in BI tools or simple file formats like CSV or Parquet.
- Interactive Dashboards & Custom Visuals – Get an instant, live view of the metrics that matter most to your business. See key performance indicators (KPIs) update in real time, drill down into the details behind any number, and view dashboards designed for different teams so operations, quality control, and leadership each see the data that is most relevant to them. Easily filter results by zone, group, asset type, shift, or time window.
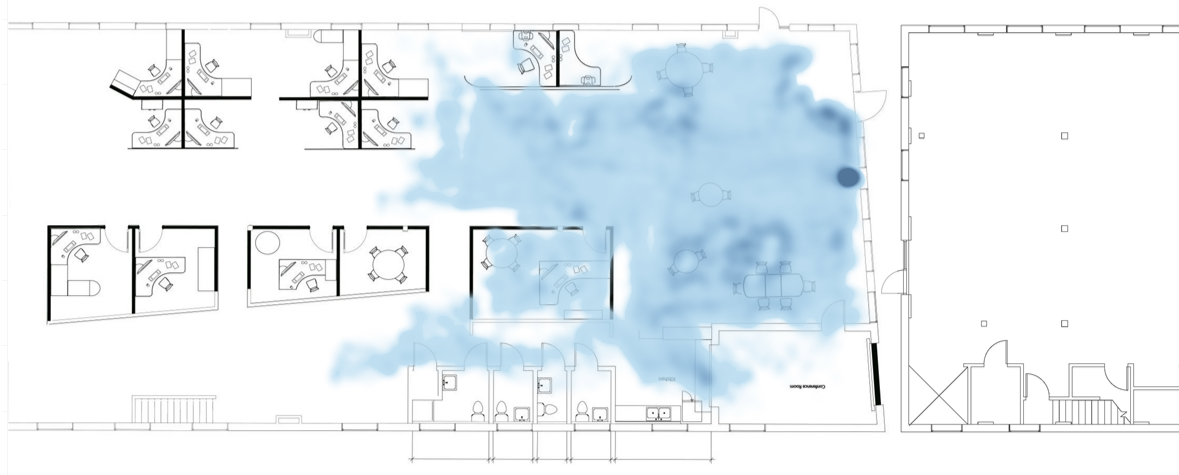
- Custom Analytics & Data Processing – Go beyond standard charts with advanced analytics powered. We prepare and process your data to uncover patterns and trends, then create custom visuals such as spaghetti diagrams that trace movement paths or heat maps that highlight areas of congestion, all directly from your RTLS data.
- Process Intelligence – Understand exactly how work moves through your facility. Track work in progress (WIP), measure how long items spend at each stage, and analyze the flow from one process to another. This helps pinpoint bottlenecks, inefficiencies, and variability in your operations.
- Event & Trigger Detection – Set rules for the events you care about, such as when an asset enters or leaves a zone, stays in one place too long, or arrives out of sequence. When these conditions occur, the system can trigger alerts, notifications, or automated actions, both in your dashboards and within the WISER Tracker platform.
Reporting for Management

- Cycle and Dwell Times: Average time spent at each step of your process.
- Bottlenecks and Delays: The top stages slowing down throughput.
- Trends Over Time: Compare performance week to week or across shifts.
- Exception Reporting: Flag assets that linger too long or skip required steps.
- Summaries for Leadership: High level KPIs such as total WIP hours, throughput, and improvements over time.
These reports can be shared in spreadsheet form, PDFs, or integrated directly into dashboards—making it easy to keep management aligned with real time operations.

This example highlights where time is being spent across different process steps, making it easy for management to spot bottlenecks and opportunities for improvement.
Benefits
- Improved Efficiency: Pinpoint bottlenecks and balance work across cells and shifts.
- Enhanced Decision Making: Operational truth in near real time without manual studies.
- Increased Productivity: Automate reporting, reduce time spent manually gathering data, and speed up continuous improvement efforts.
How It Works
1. Integration – We connect your WISER Tracker data through APIs or direct database links, aligning zones, groups, and naming conventions with your existing processes.
2. Customization – Dashboards, metrics, and visuals are tailored to your flow, SKUs, operational pace, and specific constraints, ensuring insights are relevant to your facility.
3. Ongoing Support – Our team provides quarterly tuning, dashboard enhancements, and enablement for your operations and data teams so that your analytics evolve with your business.
Tools That Power Your Analytics
We use proven analytics and visualization platforms to bring your data to life:
- Power BI: Interactive dashboards that can be filtered, shared, and embedded across your organization.
- Tableau: Advanced visual storytelling and drill-down capabilities for exploring data from different perspectives.
- Python: Custom data processing, statistical analysis, and visualizations such as spaghetti diagrams or heat maps.
These tools allow us to transform WISER Tracker data into actionable reports, dashboards, and visuals designed to fit your workflow and audience.
Ready to turn location data into decisions?
Let’s design your analytics roadmap. Contact us to schedule a consultation.
Frequently Asked Questions
Do I need WISER Tracker to use these services?
These services are designed to maximize value from WISER Tracker’s RTLS data. If you are exploring WISER, we can scope analytics alongside a pilot.
What tools can you work with?
We can deliver your dashboards and analytics in popular platforms like Tableau and Microsoft Power BI, or build custom solutions using Python for advanced analytics and tailored visualizations. Whether you already have a BI tool or need a completely custom setup, we will work with what best fits your team.
Can you integrate with our ERP/MES?
Yes. Integration can be done via API or direct to database connection with your preferred security posture.
How quickly can we see results?
Most teams see their first dashboards within weeks, with ongoing iteration thereafter.