The WISER System
Explore the capabilities of the WISER asset locating system to transform your operation by streamlining asset tracking and providing unmatched visibility.
Industrial Asset Tracking
Gain real-time visibility and control over your most valuable assets. WISER’s industrial asset tracking solutions deliver precise, sub-meter location data across complex indoor environments, so you can confidently monitor, manage, and optimize operations. From work-in-progress (WIP) tracking on busy production floors to real-time visibility of tools, equipment, and inventory across complex facilities, WISER’s system delivers accurate audit trails and excels in the most demanding industrial environments.
WISER delivers real-time asset tracking through a wireless mesh network built from ultra-wideband (UWB) antenna nodes and tracker tags. This UWB tracking system automatically and continuously calculates inch-level tag coordinates, displaying precise asset locations on your site map or facility floor plan.
Purpose-built for rugged industrial environments, WISER’s system operates through walls, around obstacles, and with minimal power. The battery life lasts years, and the plug-and-play deployment means self-installation for more facilities
Customizable Equipment Tracking
WISER’s real-time location system (RTLS) allows you to customize every tag to match your unique operations, workflows, and security needs.
- Pair tags to assets with ease
- Assign Multiple Custom Information fields to each Tag
- Assign Tag to Multiple Groups
- Search and Find tags by name or any custom field
- Built-in Role-Based Authentication for secure access
- Plug-and-Play software enables fast, low-cost deployment
Whether you’re tracking tools, equipment, or work-in-process, WISER makes real-time asset monitoring smarter, faster, and fully adaptable to your facility’s demands—delivering an industrial asset tracking solution built for your operations.

Industrial Asset Monitoring with Zone and Group Mapping
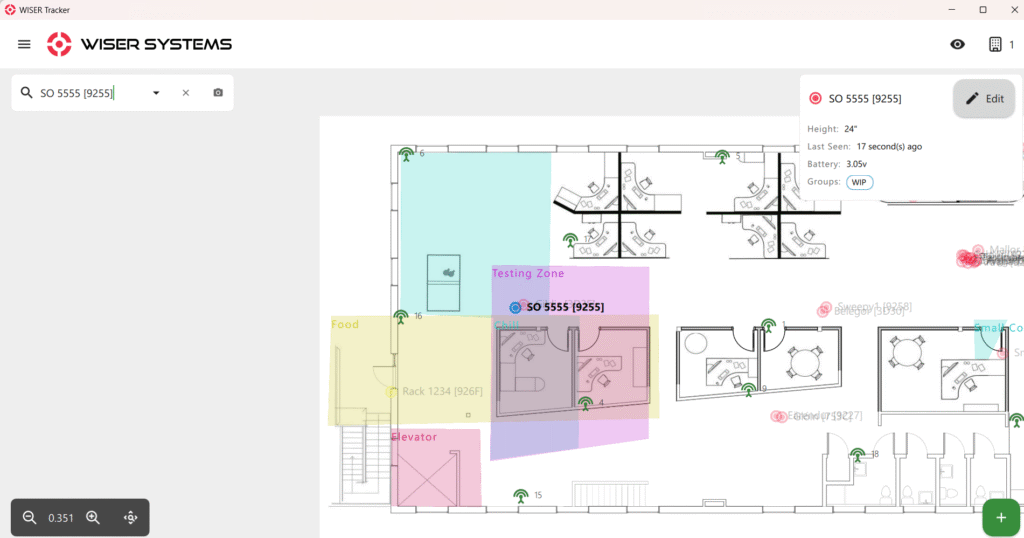
Get instant, real-time visibility of your assets with WISER’s intuitive RTLS software, a powerful indoor positioning system for your facility.
- Immediate asset visibility on your facility’s floor plan
- Ability to create and manage custom zones
- Visualization of asset locations by zone or group
- Opportunity to identify patterns and movement within defined areas
By combining precise location data with customized mapping, WISER’s real-time location system gives you full situational awareness, improving efficiency and safety across your site.
RTLS Alerts and Event Monitoring
Take asset monitoring to the next level with real-time alerts and customizable event rules. WISER’s RTLS platform lets you automate key workflows by setting conditions and triggering actions tied to asset movement, system behavior, and zone activity.
- Create rules by entity type: Tag, Group, Antenna, or Zone
- Define conditions: Entering Zone, Exiting Zone and others
- Trigger automated actions: notifications, data logging, and more
- Monitor all events in the WISER Tracker app or via your custom dashboard
Whether you need to flag high-value asset movement or log critical process events, WISER’s real-time asset tracking solutions give you complete control over alerts and their timing.
Seamless RTLS Integration with Your ERP, MES, or Database
WISER’s real-time location system fits into your existing tech stack. With flexible API access and a direct-to-database lineup, our asset tracking system integrates effortlessly with ERP, MES, or virtually any database you already use.
- API for real-time asset data sharing across software platforms
- Direct database linkup for fast, low-code deployment
- Optional translation of coordinate data into latitude/longitude
- Global connectivity for multi-site and international operations
WISER’s RTLS gives you complete visibility, from local installations to enterprise-wide asset monitoring.
Data-Driven Industrial Asset Tracking with Advanced RTLS Analytics
WISER’s advanced RTLS analytics support custom dashboards and visual tools that help you identify trends, eliminate bottlenecks, and make real-time decisions.
- Interactive dashboards customized for your facility
- Dwell Time Analysis to optimize asset movement and stage duration
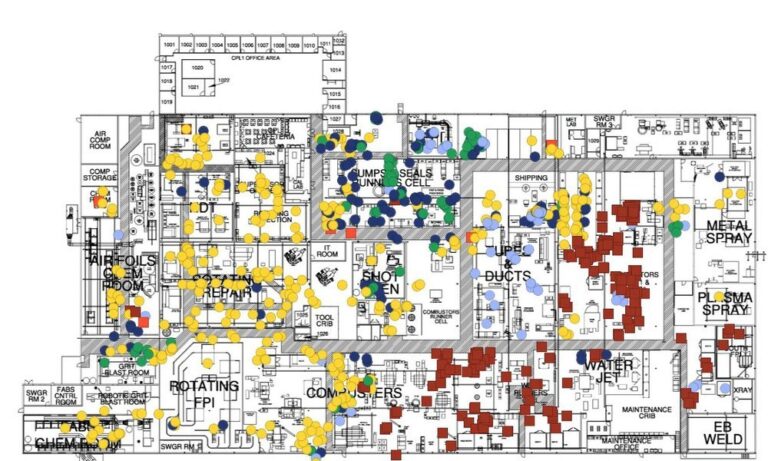
- Spaghetti Diagrams and heat maps to uncover inefficiencies in process flow
- Specialty Event Detection to trigger custom alerts or physical responses
- Process-to-Process Flow visualization for better operational alignment
With WISER, asset monitoring isn’t just about location – it’s about using location intelligence to drive results.
Ready to Upgrade Your Industrial Asset Tracking?
Our team is looking forward to demonstrating how WISER technology will transform your operation.
Looking To Learn More?
Explore real-world use cases in manufacturing, industrial assembly, and complex production environments. Discover why WISER is the RTLS partner trusted in even the most complex environments.
Making WIP Visible: How WISER’s Real-Time Search and Zone Alerts Improve Flow and Reduce Loss
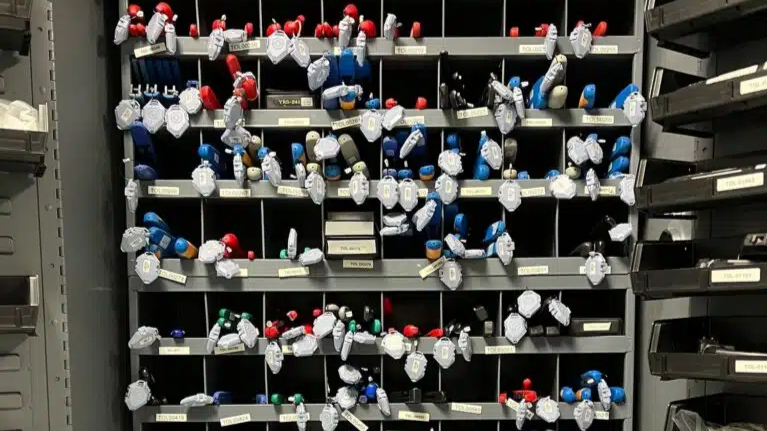
Calibrated Tool & Gauge, WIP, and Asset Tracking in an Aerospace Manufacturing Facility

Revolutionizing Real-Time Visibility on Construction Sites
Frequently Asked Questions
What makes WISER's tracking and location system different from other tracking systems?
WISER’s tracking and location system stands apart from other solutions because it combines the unmatched precision of Ultra-Wideband (UWB) technology with proprietary innovations that overcome the usual challenges found in highly reflective, busy metal environments. Unlike GPS, WiFi, or Bluetooth, which struggle with accuracy, interference, or power demands, WISER’s UWB delivers location data accurate to within a meter, even in complex, obstacle-filled environments like factories, warehouses, or laydown yards.
How can I be sure an asset tracking system is scalable for my use case?
Scalability is a top challenge for nearly any process-improvement system, and asset tracking is no different. Assuming you’ve already vetted your asset tracking system vendor adequately, the three biggest obstacles to scalability tend to be 1) technological limitations, 2) cost, and 3) labor. The best way to determine if your asset tracking project is scalable is to map out how these obstacles intersect in the case of your own asset tracking project.
What kinds of assets can WISER’s system track?
Our micro-location system excels at locating and tracking almost any type of material asset, ranging from crates, pallets, bins, and shipping containers to forklifts, hand-trucks, individual tools, robots, manufactured parts, hard-hats, security badges, electronic devices, and more.
Setting up our mesh antenna nodes is a straightforward process. Once in place, simply attach a WISER Tracker Tag to the asset you wish to locate. For real-world examples of the system in action, check out WISER’s current Case Studies and Blog to witness the seamless tracking of diverse assets.